We measure the ground
Our sensors read the rain, rivers and soil, backed by a decade of data.
iGrid combines sensors on the ground and satellites above into one flood score for any location.
Fig. 1 · Illustrative portfolio readout. An example of iGrid output for a book of locations.
Three steps to one number.
Our sensors read the rain, rivers and soil, backed by a decade of data.
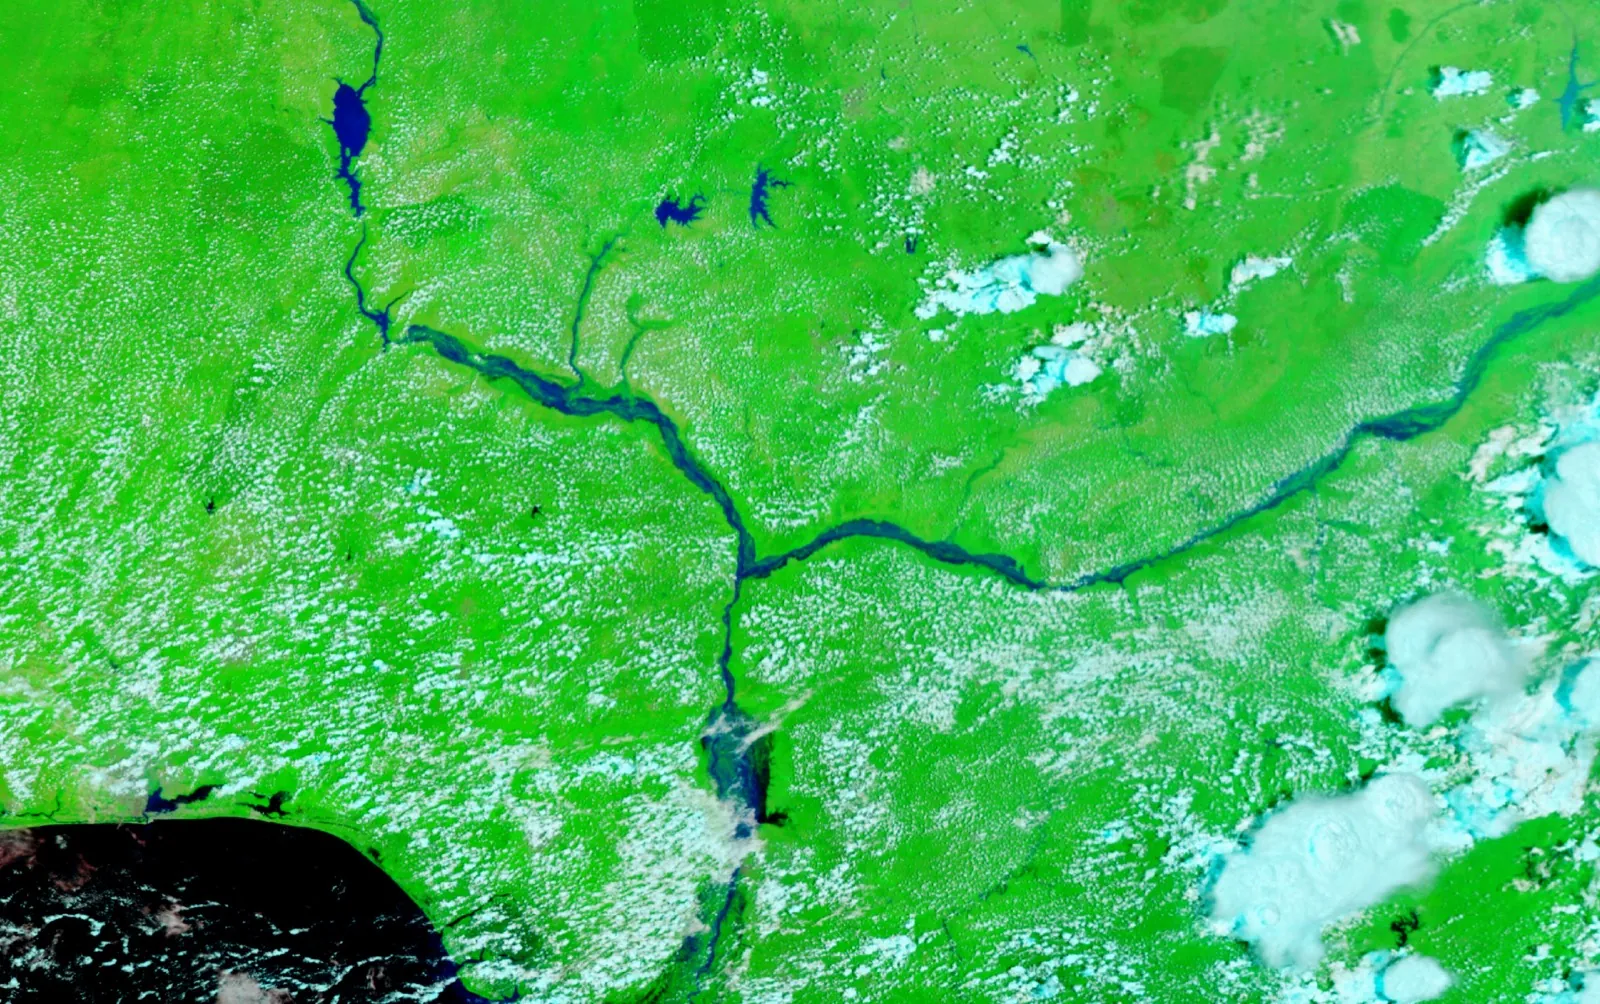
Satellites see the water from space and map any flood within hours.
Our models turn it into one flood score, 0 to 100, for any address.
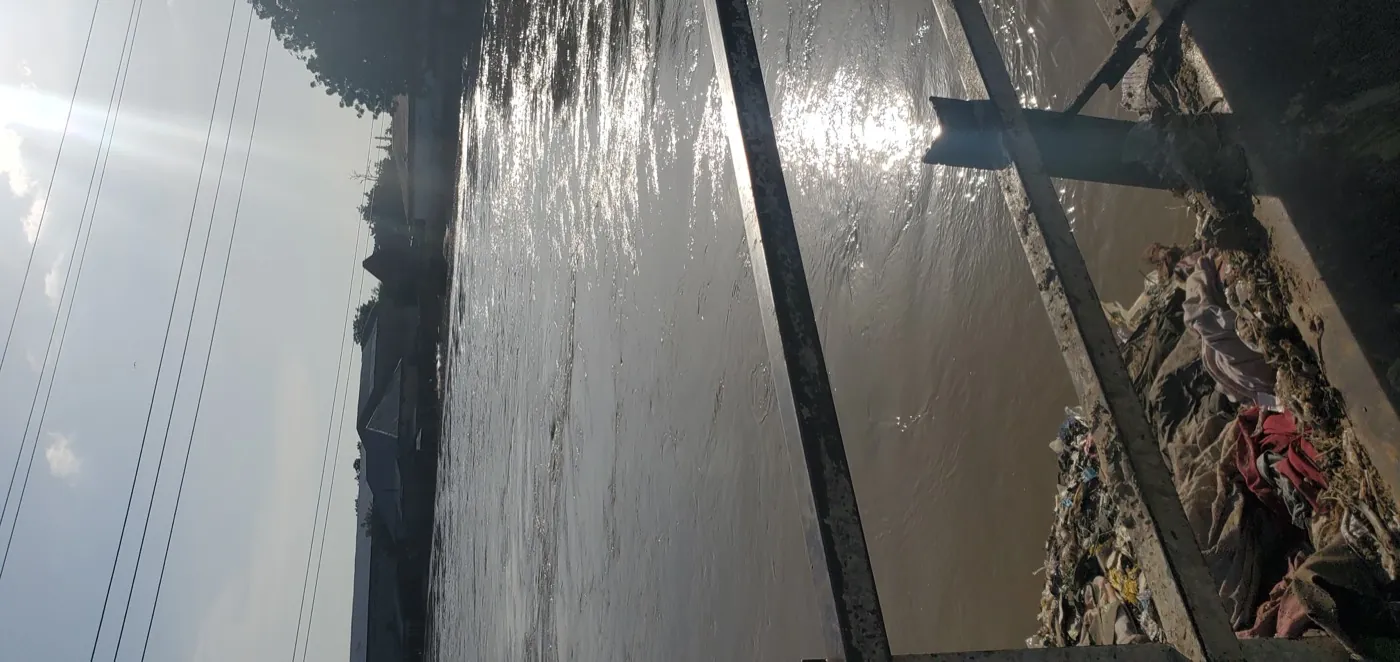
When a flood hits, iGrid maps its reach within hours.
One answer, for one address or a whole country.
How likely a flood is and how deep it could get, for one home or a whole portfolio.
We map exactly where a flood reached, within hours.
A report, a data file, or a live feed into your systems.
Rain, rivers, coast and groundwater, across Africa.
Quote, reserve and reinsure flood cover with confidence.
See where the flood will hit, plan ahead, and pay out fast.
Know the flood risk behind a property, a loan, or a supply chain.
Every score can be traced to what it was built from, and the same inputs always give the same number. Every model is tested against real past floods first.
The full method and test results are available to partners under NDA.
From one roof to a whole country, in a single pass.